Recommended
This note presents estimates of Finance for International Development (FID) in 2018. FID is a grant equivalent measure of cross-border, concessional finance publicly provided for development. We introduced FID last year to better compare development finance provided by both DAC (OECD Development Assistance Committee) and non-DAC countries, the latter having gained importance as development actors in recent decades. We produced estimates of FID for 40 of the world’s major economies, which accounted for around 90 percent of global GDP in 2018. FID attempts to measure all cross-border assistance given for the purpose of development—including grants, technical assistance, and the grant equivalent of all concessional loans and contributions to multilateral organisations—but excludes various in-donor costs (such as spending on scholarships) that are part of the DAC’s own measure of development assistance, official development assistance (ODA). The full FID methodology is available in an earlier CGD working paper.
Key findings from the latest FID data are summarised below:
- A total of $156.6bn of FID was provided in 2018 by this group of 40 countries, increasing by $7.3bn from its 2017 level of $149.3bn (up 5 percent).
- Total FID has remained constant relative to GNI between 2017 and 2018, equivalent to 0.21 percent of the combined GNI of its 40 providers.
- Of total FID in 2018, 83 percent ($130.2bn) was provided by the DAC, and 17 percent ($26.4bn) by 13 non-DAC countries. This is a slight shift since 2017, when the respective split was 84 percent to 16 percent.
- In 2018, DAC countries provided a total of 0.26 percent of their combined GNI as FID, compared to 0.10 percent of GNI for non-DAC countries. This remained unchanged from 2017. However, Turkey, UAE, and Saudi Arabia—all non-DAC countries—each provided more than double the DAC average.
- The growth rate in the nominal value of FID provided was fastest among non-DAC countries. For non-DAC countries, FID increased by 9.8 percent (up $2.3bn) from 2017 to 2018; compared to 3.9 percent (up $4.9bn) for DAC countries.
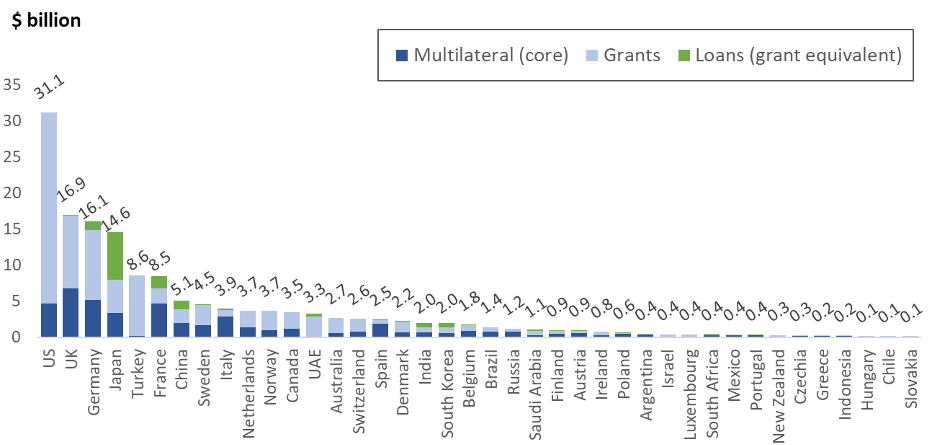
- In 2018, 31 percent ($48.6bn) of total FID was provided as core contributions to multilateral organisations; this share remaining unchanged from 2017. The majority of FID was still provided bilaterally: 61 percent ($95.6bn) as grants, and 8 percent ($12.4bn) as the grant equivalent value of loans and equity investment.
- Multilateral core contributions were higher on average amongst DAC donors, comprising 34 percent of their total FID, versus 17 percent for non-DAC countries. However, the lower multilateral share of non-DAC FID is driven by Turkey, Saudi Arabia, and UAE, which provide almost all their FID bilaterally. Excluding these three countries causes the multilateral share of non-DAC FID to jump to 43 percent (higher than the DAC average).
- Among the DAC, the largest provider of FID in absolute terms remained the US, giving $30.0bn in 2018. In relative terms the largest DAC provider also remained unchanged: Luxembourg, giving 0.99 percent of its GNI as FID in 2018.
- Among non-DAC countries, the largest provider of FID in both absolute and relative terms remained Turkey, giving $8.3bn in 2018, equivalent to 1.09 percent of its GNI.
- Significant 2017-18 changes within the group of DAC countries include Germany increasing its FID by $2.6bn (16 percent) and France’s increase of $1.0bn (12 percent). Meanwhile, FID fell by $1.4bn (-9 percent) for Japan and $1.1bn (-4 percent) for the US.
- Among non-DAC countries, Saudi Arabia was notable for its 286 percent ($3.2bn) increase (nearly quadrupling) in FID from 2017 to 2018; while 2018 FID for Argentina, Chile, and Mexico was between a fifth and quarter of its level the prior year, when large capital contributions to the Inter-American Development Bank were made.
- For DAC countries, it is possible to compare FID with ODA. For these donors in 2018, FID ($130.2bn) was $23.1bn lower than ODA ($153.3bn), primarily driven by the inclusion of in-donor refugee and administrative costs in ODA.
Background
We introduced FID last year in order to produce estimates of concessional development assistance that were comparable between both DAC and non-DAC countries.
The most prominent measure of concessional development finance is undoubtedly official development assistance (ODA). However, this is only produced for countries who are members of the Development Assistance Committee (DAC), and a few others who choose to report voluntarily. Some of the largest economies—such as India and China—are not included in this group. While most are still significantly behind DAC members in terms of GNI per capita, these countries nevertheless have significant development cooperation programmes and have for some time. Failing to capture these flows will underestimate total assistance available to developing countries and produce a rich-world-centric view of development finance.
In addition, ODA has become increasingly controversial. There is a lack of agreement on the inclusion of some items, as evidenced by Luxembourg declining to include “in-donor refugee costs” in their ODA figure on principle. The inclusion of debt forgiveness alongside discount rates intended to reflect risk inflates the degree of donor effort recorded on loan transactions, and measuring public and private sector loans on a different basis means aggregates are hard to interpret.
FID focuses solely on development assistance that crosses borders, and measures private and public sector loans on the same basis. Data for countries that report to the DAC are taken from the OECD’s Creditor Reporting System (CRS), and data for the remaining countries have been assembled on a case-by-case basis from various official sources.
Overall results
In 2018, the 40 major economies included in this measure provided $156.6 billion in FID (in current terms), an increase of 5 percent relative to 2017. Around 17 percent of this ($26.4bn) was provided by countries beyond the DAC. For both DAC and non-DAC countries, this increase was in line with increase in GNI: relative to the size of these economies, FID remains unchanged relative to 2017, at 0.21 percent overall.
Table 1. Total Finance for International Development
| USD Billion | % of GNI | ||||
|---|---|---|---|---|---|
| 2017 | 2018 | 2017 | 2018 | ||
| DAC | 125 | 130 | 0.26 | 0.26 | |
| Non-DAC | 24 | 26 | 0.10 | 0.10 | |
| Total | 149 | 157 | 0.21 | 0.21 |
In absolute terms, the US provided the most FID at $30.0 billion, followed by Germany and the UK ($18.6 billion and 17.8 billion, respectively). In 2017, the UK was ahead of Germany, but in 2018 the share of Germany’s ODA spent on in-country refugee costs fell substantially (by $2.2 billion). There were three countries beyond the DAC who were among the top 10 providers in absolute terms: Turkey, China, and Saudi Arabia ($8.3 billion, $5.7 billion, and $4.3billion). Aside from the UAE, no other non-DAC country was among the top half largest providers (India was the next largest, providing $1.7 billion, and ranking 21st among the 40 countries considered).The split between bilateral and multilateral FID remained the same as 2017 at 31 percent, although this hides an increase among DAC donors (from 32 percent to 24 percent) and a sharper decline in non-DAC multilateral share (from 24 percent to 17 percent). Among both groups, there was a slight increase in the share of grants in bilateral aid, and in total, bilateral grant FID increased from 59 percent to 61 percent of total FID.The figures quoted so far all pertain to the pre-COVID 19 period, which is likely to have significant implications for FID provided from all countries. For instance, following the economic and fiscal impact of COVID-19, the UK has significantly cut its ODA budget, whereas others have increased foreign assistance to help poorer countries tackle the consequences of the pandemic.
Compared to GNI, Turkey remains the country to provide the most FID, providing 1.09 percent in 2018, and the only country to provide more than 1 percent of GNI. The vast majority of Turkish FID (over 80 percent) is humanitarian support for Syria, with which it shares a border. Luxembourg and Sweden ranked second and third respectively, providing 0.99 percent and 0.92 percent.
Among non-DAC providers, there was a notable split between Turkey, UAE, and Saudi Arabia, each of which were in the top 10 providers of FID relative to GNI (providing 1.09 percent, 0.91 percent and 0.54 percent, respectively) and the remaining, all of which were in the bottom 10. Mexico and Chile were bottom, each providing FID worth around 0.01 percent of GNI. For the three outliers, there are particular situations which may be relevant in explaining this difference. As noted, the majority of Turkish FID is provided to its neighbour, Syria. For both Saudi Arabia and UAE, the majority of FID provided is humanitarian support to Yemen (82 percent and 62 percent, respectively), a country experiencing conflict in which both countries are actively involved. However, the OECD report that Saudi Arabia’s provision of development assistance was previously far higher than even current levels.
Biggest changes
In both absolute and percentage terms, Saudi Arabia increased its FID the most: providing $4.3 billion in 2018, compared to $1.1 billion the previous year, primarily as a result of a significant increase in budget support provided to Yemen (Saudi FID to Yemen increased from $370 million to $3.5 billion between 2017 and 2018, and Yemen accounted for over 80 percent of Saudi Arabia’s FID in 2018).
France and Germany were the only two other countries to increase FID by more than $1 billion ($1.0 billion and $2.6 billion respectively), in each case largely as a result of large increases in multilateral contributions. Germany became the second largest provider as a result of this increase, overtaking the UK (Germany was already ahead in ODA terms because of in-donor refugee costs which are removed from FID).
We estimate that, based on official sources (collated in part by N. Kitano of the JICA institute), in 2018 China increased its FID to $5.7bn, a 11 percent increase relative to 2017. This figure is much smaller than, but consistent with, much larger estimates of the face value of China’s annual lending in the tens of billions, as this measures only the concessional element (see our previous paper for full discussion). This year’s increase was mainly a result of an increase in grant financing, offset by slightly smaller multilateral contributions. This increase contrasts with assessments by researchers specialising in Chinese lending; for example the China Africa Research Initiative (SAIS-CARI) and Boston University’s Global Development Policy Center (GDPC) both report a large fall in Chinese lending in 2018. These figures are more inclusive than those we present in this report, and attempt to measure the entire portfolio of Chinese lending including both export credits, and non-concessional loans. By contrast, we are only interested in the grant equivalent of loans with a development purpose. However, there remains significant uncertainty about China’s loan estimates: we have limited ourselves to official sources and are likely underestimating the grant equivalent of China’s entire loan portfolio (see FID 2020 for fuller discussion). Further transparency from China on its lending portfolio and associated terms would therefore likely lift our estimate of their FID.
Several Latin American countries have recorded a significant decline in FID in 2018. This is because in 2017 such countries recorded a significant contribution to IADB in the form of “additional paid-in capital.” This capital contribution was a special case, whereby equity in a special fund (contributions to the Fund for Special Operations) of the IADB was transferred to the IADB’s main account (instead of being transferred to the countries in question), and in 2017 contributed a large share of these countries’ overall FID. As a result, in 2018 Argentina, Chile, and Mexico each saw declines of more than 70 percent. Brazil’s FID declined by just under 40 percent.
For countries reporting to the DAC, data is also available for 2019. For the 27 DAC countries included, FID declined in 2019 by 1.0 percent, from $130 billion to $129 billion, although this was slightly smaller than the decline in ODA (of 1.2 percent, the difference pertained mainly to lower in-provider refugee costs). FID also fell as a share of GNI, to 0.25 percent. For the five countries reporting to the DAC voluntarily (Israel, Russia, Saudi Arabia, Turkey, and UAE) there was a sharper decline of 24 percent between 2018 and 2019.
ODA and FID
ODA is the most prominent measure of international development assistance but is only produced for countries who are member of the DAC, and a few countries who voluntarily report. Broadly, ODA is a measure of donor effort, rather than a measure of flows that reach partner countries, and include items that are not universally regarded as part of foreign development assistance. While spending items such as in-donor scholarships and refugee costs may reflect donor effort and so their inclusion in ODA can be justified, they do not necessarily reflect an actual transfer of resources to partner countries. In addition, the concept of ODA is not widely endorsed by countries beyond the DAC.
FID, therefore, makes a number of changes to ODA, so that as far as possible, FID is measuring only cross-border flows. However, it also measures only the grant equivalent of private sector loans (measured using the same methodology) and where possible, includes the grant equivalent of loans that would not be sufficiently concessional to count as ODA, given that these thresholds were agree as part of DAC and therefore are not applicable to non-DAC countries.1 Table 2 shows the relationship between FID and ODA; Mitchell et al. provides full details.
Table 2. FID and ODA for countries reporting to the DAC, 2018, USD billion
| ODA | 153.3 |
| Change resulting from: | |
| In-donor refugee costs | -10.8 |
| In-donor scholarships/imputed student costs | -3.5 |
| Administration costs not elsewhere included | -7.8 |
| Promotion of development awareness | -0.4 |
| In-donor research | -0.2 |
| Debt relief | -0.2 |
| Difference in private sector loan measurement | -0.3 |
| Inclusion of grant equivalent of OOF | 0.1 |
| Finance for International Development (FID) | 130.2 |
1We are aware that our estimates of OOF are incomplete. We have requested information on OOF loans from all agencies with significant portfolios, but only France provided us with sufficient information to calculate the grant equivalent of OOF loans. Lack of transparency concerning non-ODA loans is an issue for which DAC countries are drawing increasing criticism. Analysis in the previous report suggest that because grant elements of such loans are small, they will not change the picture substantially.
The main difference between FID and ODA remains in-provider refugee costs, although spending on this category fell from $14.1 billion to $9.6 billion between 2017 and 2019. Debt relief scored as ODA also fell (from $435 million to $93 million over the same period) but this is anticipated to increase again in subsequent years (France has already signalled its intention to forgive a large amount of export credits). Spending on scholarships and administrative costs not included as part of projects increased, by $364 million and $885 million over this period. The difference resulting from measuring private sector loans on a grant equivalent basis also increased, from $129 million in 2017 to $480 million 2019 (largely driven by France).
Table 3. ODA-eligible spending items not included in FID - countries reporting to the DAC (USD million, current)
| In-provider refugee costs | In-provider scholarships | Administrative costs NEC | Debt Relief | In-provider Research | Promotion of development awareness | Difference in private loan measurement | |
|---|---|---|---|---|---|---|---|
| 2017 | 14088 | 3200 | 7553 | 435 | 116 | 318 | 129 |
| 2018 | 10755 | 3501 | 7826 | 237 | 190 | 384 | 280 |
| 2019 | 9624 | 3564 | 8438 | 93 | 240 | 359 | 484 |
Note: Note that in 2017 FID exceeds 100% of ODA for Japan and Turkey. Whilst FID always uses the grant equivalent of loans and equity investment to measure development finance, headline ODA figures did not yet use this methodology in 2017. Instead, these were based on net disbursements. Significant loan repayments in 2017 for Japan and Turkey reduce their official ODA figures below the grant equivalent value, allowing FID to exceed headline ODA
Changes to methodology
UN data
For years 2018 onwards, the UN started collecting data on contributions that are earmarked for spending within the providing country. In the previous edition of FID, in the absence of such information, we took the conservative approach of assuming that only the difference between earmarked contributions from a provider and spending within that provider represented true cross-border flows (i.e., if earmarked contributions to a UN organisation were lower than the amount that UN organisation spent in the providing country, we assumed that all contributions were earmarked to be spent domestically). While this produced a conversative estimate in general, missing expenditure for the Pan American Health Organization meant that we nevertheless overstated Brazil’s FID. This year we have updated 2017 figures to reflect the additional data.
China breakdown between interest-free loans and grants
China’s FID data includes the “Foreign Aid” budget line from the central budget expenditure table. This figure includes both grants and interest-free loans. In the previous edition of FID, the most recent information we could find on this composition was from the 2014 White Paper on foreign aid, which pertained to 2010-2012. We have updated this split using the recently published White Paper on Development Cooperation. While the figures in this paper pertain to 2013-2018 as a whole and not 2017-2018 in particular, we view this as an improvement.
Multilateral contributions from countries reporting to the DAC
In the previous edition, we included multilateral contributions from DAC-reporting countries on a net disbursement basis, rather than a grant equivalent basis because the latter was missing for several countries for 2017. However, given that FID aims to measure flows on a grant equivalent basis, and full data is available for 2018, we have changed to using the grant equivalent contributions, for both 2017 and 2018. There were eight countries with missing data for 2017. For seven, only grants were extended and so the net/grant equivalent figures were equal. For the remaining country (France) the difference is small.
Data sources
All data sources are set out in the FID methodology, available in the previous edition. A number of country data sources used in the previous edition have not been updated. These include bilateral FID from Argentina and Mexico, and bilateral loans from India’s EXIM bank.
For further reading, please see the full FID working paper published last year, which contains the full methodology and a detailed overview of sources:
Mitchell, I., Ritchie, E., & Rogerson, A. (2020). “Finance for International Development (FID): A New Measure to Compare Traditional and Emerging Provider Countries’ Official Development Finance Efforts, and Some Provisional Results.” Center for Global Development, Working Paper 529
Rights & Permissions
You may use and disseminate CGD’s publications under these conditions.